<![CDATA[Seven Story Rabbit Hole]]>2022-10-31T16:03:48-07:00http://tleyden.github.io/Octopress<![CDATA[Moving to a new blogging platform]]>2022-10-28T13:03:00-07:00http://tleyden.github.io/blog/2022/10/28/moving-to-a-new-blogging-platformOctopress has treated me well over the years, but with the advent of more modern blogging platforms like Ghost I decided it was time to switch. Check out my new ghost blog!
Ghost advantages
Open source for hackability.
Hosted and self-hosted offerings, with easy migration either direction.
Very clean interface like Medium.
You own all your content, unlike Medium.
Extensible with plugins and themes.
Easy to inject markdown snippets or embed many types of content.
WYSIWIG editing straight from the browser is really nice and feels like a faster workflow.
There are options to create a paid newsletter (a la substack).
Ghost disadvantages
Since it’s not a static blog, you can’t just push to github pages and be done with it.
Self-hosting is a bit of a pain. My server ran out of memory and I ended up throwing in the towel and going with the Ghost Pro hosted version for now. (though I can always easily go back later, which is nice)
Ghost Pro costs money.
Octopress advantages
When published to github pages, you get an amazing lightning-fast hosting service completely free.
Markdown-centric means the content is very portable to other places that natively support markdown.
Octopress disadvantages
Maintaining the ruby tooling can be a bit of a pain. Upgrading is scary, so I got stuck at an old version.
Extensibility seemed like a pain so I personally didn’t bother.
Feels a bit archaic at this point.
]]><![CDATA[Installing Autoware on Ubuntu 20.04]]>2022-10-19T14:10:00-07:00http://tleyden.github.io/blog/2022/10/19/installing-autowareThis is a log of my experience installing Autoware on my bare metal laptop running Ubuntu 20.04. I had a ton of stumbling blocks but stuck with it and eventually got it working. I documented it along the way, so if you hit any of those same issues this might be useful to you.
As a warning, this blog post is pretty messy because of all those stumbling blocks, so you’re probably better off just following the official autoware installation docs and referring to this in case you run into the same problems.
Nvidia Driver Version: 470.141.03 CUDA Version: 11.4 (upgraded during this blog post to Driver Version: 510.73.05 CUDA Version: 11.6)
Pre-install steps
Choose Ubuntu Linux version
Autoware currently supports both 20.04 and 22.04 (but not 18.04), and I decided to go with 20.04 since it was the next LTS version after the version I had installed (18.04).
I noticed that autoware recommended cuda version of 11.6, which only has official downloads for 20.04 and not 22.04, so that made me think that Ubuntu 20.04 was the better choice.
Install docker engine based on these instructions. This links to the snapshot of the instructions that I used (as do below links). If you want to use the latest instructions, change the 0423b84ee8d763879bbbf910d249728410b16943 commit hash in the URL to main.
which seemed to work, as it dropped me into a container:
12
tleyden@86a918b83192:~/Development/autoware$ docker ps
bash: docker: command not found
Based on the response from the super helpful folks at Autoware in this discussion I determined I needed to upgrade my Cuda version based on these instructions. (see later step below)
Install vcstool
In the source instructions, it mentions that autoware depends on vcstool, which is a tool that makes it easy to manage code from multiple repos.
According to the docs: “Ad hoc simulation is a flexible method for running basic simulations on your local machine, and is the recommended method for anyone new to Autoware.”, but there are no docs on how to do run an ad hoc simulation, so I am going to try a planning simulation based on the planning simulation docs
# apt-get -y install cuda
Reading package lists... Done
Building dependency tree
Reading state information... Done
Some packages could not be installed. This may mean that you have
requested an impossible situation or if you are using the unstable
distribution that some required packages have not yet been created
or been moved out of Incoming.
The following information may help to resolve the situation:

The following packages have unmet dependencies:
 cuda : Depends: cuda-11-6 (>= 11.6.0) but it is not going to be installed
E: Unable to correct problems, you have held broken packages.
Based on this advice, I’m going to re-install. First I am purging:
I simply rebooted, and now nvidia-smi works. Note that the cuda version went from 11.7 to 11.6. The strange thing is that previously I idn’t have the cuda packages installed.
12345
$ nvidia-smi
Fri Oct 21 13:56:48 2022
+-----------------------------------------------------------------------------+
| NVIDIA-SMI 510.73.05    Driver Version: 510.73.05    CUDA Version: 11.6     |
|-------------------------------+----------------------+----------------------+
$ rocker --nvidia --x11 --user --volume $HOME/Development/autoware --volume $HOME/Development/autoware_map -- ghcr.io/autowarefoundation/autoware-universe:latest-cuda
tleyden@apollo:~$ rocker --nvidia --x11 --user --volume $HOME/Development/autoware --volume $HOME/Development/autoware_map -- ghcr.io/autowarefoundation/autoware-universe:latest-cuda
Extension volume doesn't support default arguments. Please extend it.
Active extensions ['nvidia', 'volume', 'x11', 'user']
Step 1/12 : FROM python:3-slim-stretch as detector
...
Executing command:
docker run --rm -it  --gpus all -v /home/tleyden/Development/autoware:/home/tleyden/Development/autoware -v /home/tleyden/Development/autoware_map:/home/tleyden/Development/autoware_map  -e DISPLAY -e TERM   -e QT_X11_NO_MITSHM=1   -e XAUTHORITY=/tmp/.docker77n9jx85.xauth -v /tmp/.docker77n9jx85.xauth:/tmp/.docker77n9jx85.xauth   -v /tmp/.X11-unix:/tmp/.X11-unix   -v /etc/localtime:/etc/localtime:ro  d0c01d5fe6d7
tleyden@0b1ce9ed54bd:~$
This worked, but at first I was very confused that it actually worked.
It drops you back at the prompt with no meaningful output, but if you look closely, it’s a different prompt. The hostname changes from your actual hostname (apollo in my case), to this cryptic container name (0b1ce9ed54bd).
Note that if you run this in the container:
123
$ ros2 topic list
/parameter_events
/rosout
you will see meaningful output, whereas if you run that on your host, you will most likely see ros2: command not found, unless you had installed ros2 on your host previously.
[rviz2-33] libGL error: MESA-LOADER: failed to retrieve device information
[rviz2-33] libGL error: MESA-LOADER: failed to retrieve device information
[rviz2-33] [ERROR] [1666388259.903611735] [rviz2]: RenderingAPIException: OpenGL 1.5 is not supported in GLRenderSystem::initialiseContext at /tmp/binarydeb/ros-galactic-rviz-ogre-vendor-8.5.1/.obj-x86_64-linux-gnu/ogre-v1.12.1-prefix/src/ogre-v1.12.1/RenderSystems/GL/src/OgreGLRenderSystem.cpp (line 1201)
[rviz2-33] [ERROR] [1666388259.905397712] [rviz2]: rviz::RenderSystem: error creating render window: RenderingAPIException: OpenGL 1.5 is not supported in GLRenderSystem::initialiseContext at /tmp/binarydeb/ros-galactic-rviz-ogre-vendor-8.5.1/.obj-x86_64-linux-gnu/ogre-v1.12.1-prefix/src/ogre-v1.12.1/RenderSystems/GL/src/OgreGLRenderSystem.cpp (line 1201)
Note that these errors are also shown if I run rviz2 from within the container.
1234567
$ rviz2
QStandardPaths: XDG_RUNTIME_DIR not set, defaulting to '/tmp/runtime-tleyden'
libGL error: MESA-LOADER: failed to retrieve device information
libGL error: MESA-LOADER: failed to retrieve device information
[ERROR] [1666389050.804997231] [rviz2]: RenderingAPIException: OpenGL 1.5 is not supported in GLRenderSystem::initialiseContext at /tmp/binarydeb/ros-galactic-rviz-ogre-vendor-8.5.1/.obj-x86_64-linux-gnu/ogre-v1.12.1-prefix/src/ogre-v1.12.1/RenderSystems/GL/src/OgreGLRenderSystem.cpp (line 1201)
[ERROR] [1666389050.805238544] [rviz2]: rviz::RenderSystem: error creating render window: RenderingAPIException: OpenGL 1.5 is not supported in GLRenderSystem::initialiseContext at /tmp/binarydeb/ros-galactic-rviz-ogre-vendor-8.5.1/.obj-x86_64-linux-gnu/ogre-v1.12.1-prefix/src/ogre-v1.12.1/RenderSystems/GL/src/OgreGLRenderSystem.cpp (line 1201)
[ERROR] [1666389050.805275164] [rviz2]: InvalidParametersException: Window with name 'OgreWindow(0)' already exists in GLRenderSystem::_createRenderWindow at /tmp/binarydeb/ros-galactic-rviz-ogre-vendor-8.5.1/.obj-x86_64-linux-gnu/ogre-v1.12.1-prefix/src/ogre-v1.12.1/RenderSystems/GL/src/OgreGLRenderSystem.cpp (line 1061)
Workaround rviz2 errors by passing in /dev/dri device
“For Intel integrated graphics support you will need to mount the /dev/dri directory as follows:”
1
--devices /dev/dri
After restarting a container with that flag, it no longer shows the libGL error: MESA-LOADER: failed to retrieve device information error.
I posted a question on the autoware forum to find out why this workaround was needed. Apparently there is another way to solve this problem by forcing the use of the nvidia gpu rather than the intel graphics card:
1234
prime-select query
# It should show on-demand by default
sudo prime-select nvidia
# Force to use NVIDIA GPU
]]><![CDATA[Installing Ghost on AWS Lightsail with SQLite]]>2020-06-27T09:59:00-07:00http://tleyden.github.io/blog/2020/06/27/installing-ghost-on-aws-lightsail-with-sqliteHere are my requirements for a Ghost blogging platform backend:
Cheap – ideally under $5 / month
Ability to setup multiple blogs if I later want to add a new blog hosted on a different domain: so blog1.domainA.com + and blog2.domainB.com, without increasing cost.
Easy to manage and backup
Non-requirements:
High traffic
Avoiding CLI or some server management (would be nice, but does that exist for < $5 month?)
And here is the tech stack:
AWS Lightsail instance running Ubuntu 18
SQLite
Nginx
Node.js
Ghost Node.js module(s)
SQLite was chosen over MySQL since this is one less “moving part” and slightly easier to manage. See this blog post for the rationale.
Launch a Lightsail instance
Lightsail seems like a good value since you can get a decent sized instance and a static IP for $5.
Login to the AWS console and create a Lightsail instance with the following specs:
Blueprint: OS Only Ubuntu 18.04 LTS
SSH key: upload your ~/.ssh/id_rsa.pub (maybe make a copy and rename it with a better name to easily find it in the AWS console later)
Instance Plan: $5/mo with 1GB or RAM, 1 vCPU, 40 GB SSD and 2 TB of transfer. Ghost recommends at least 1 GB of RAM, so it’s probably better to use this instance size or greater.
Identify your instance: rabbit (or whatever you wanna call it!)
You should see the following:
Create a static ip
Go to the Lightsail Networking section, and choose “Attach static ip”. Associate the static ip with the lightsail instance, and make a note of it as you will need in the next step.
Add DNS A record
Go to your DNS register where you registered your blog domain name (eg, Namecheap), and add a new A record as follows:
Use “blog” for the host if you want the blog named “blog.yourdomain.com”, but you could also name it something else.
Use the public static ip address created in the previous step.
Install Ghost dependencies
ssh in via ssh ubuntu@<your ligthsail instance ip>
I decided to setup SSL in a separate step rather than initially, but the more secure approach would be to use https instead, eg https://blog1.domainA.com for the blog URL and answer Yes to the setup SSL question, which will trigger SSL setup initially.
If you do setup SSL, you will need to open port 443 in the Lightsail console, otherwise it won’t work. See the “Setup SSL” section below for instructions.
Create Ghost admin user
This part is a little scary, (and ghosts are scary), but Ghost basically puts your blog unprotected to the world without an admin user. The first person that stumbles across it gets to become the admin user. You want that to be you!
You now have two separate Ghost blogging sites setup on a single $5 / mo AWS Lightsail instance.
Appendix
Error installing ghost due to node.js being out of date
If you see this error:
12345678910111213141516171819202122232425262728
$ ghost install --db sqlite3
You are running an outdated version of Ghost-CLI.
It is recommended that you upgrade before continuing.
Run `npm install -g ghost-cli@latest` to upgrade.

✔ Checking system Node.js version - found v12.22.10
✔ Checking logged in user
✔ Checking current folder permissions
✔ Checking system compatibility
✔ Checking memory availability
✔ Checking free space
✔ Checking for latest Ghost version
✔ Setting up install directory
✖ Downloading and installing Ghost v5.20.0
A SystemError occurred.

Message: Ghost v5.20.0 is not compatible with the current Node version. Your node version is 12.22.10, but Ghost v5.20.0 requires ^14.17.0 || ^16.13.0

Debug Information:
    OS: Ubuntu, v18.04.1 LTS
    Node Version: v12.22.10
    Ghost-CLI Version: 1.18.1
    Environment: production
    Command: 'ghost install --db sqlite3'

Try running ghost doctor to check your system for known issues.

You can always refer to https://ghost.org/docs/ghost-cli/ for troubleshooting.
Fix option #1 – specify an older version of ghost
Find an older version of ghost that is compatible with the node.js you have installed, then specify that version of ghost when installing it:
1
$ ghost install 4.34.3 --db sqlite3
How do you find that version? I happened to have another blog folder that I had previously installed, so I just used that. Maybe on the ghost website they have a compatibility chart.
The downside of this approach is that you won’t have the latest and greatest version of ghost, including security updates. The upside though is that you won’t break any existing ghost blogs on the same machine by upgrading node.js.
Fix option #2 – upgrade to a later node.js and retry
In the error above, it mentions that ghost requires node.js 14.17.0 or above.
The downside is that this could potentially break other existing ghost blogs on the same machine that are not compatible with the later version of node.js. Using containers to isolate dependencies would be beneficial here.
Run node -v to verify that you’re running a recent enough version:
12
$ node -v
v14.20.1
Update the ghost cli version:
1
sudo npm install -g ghost-cli@latest
Retry the ghost install command:
1
ghost install --db sqlite3
and this time it should not complain about the node.js version.
Setup SSL
During installation, you can answer “Yes” to setup SSL, and it will ask you for your email and use letsencrypt to generate a certificate for you. See this page for more details.
But you must also open port 443 in your Lightsail firewall, otherwise it won’t work.
Auto-renew SSL cert every 90 days
Lets Encrypt certificates expire after 90 days. To avoid downtime on your site, you should auto-renew the certificates. See this blog post for details.
I tried to follow the blog post, and ran ghost setup ssl-renew in my blog folder, but after switching to root with sudo su, I noticed this existing cron entry:
]]><![CDATA[OpenWhisk Action Sequences]]>2017-07-02T11:30:00-07:00http://tleyden.github.io/blog/2017/07/02/openwhisk-action-sequencesThis will walk you through getting up and running from scratch with Apache OpenWhisk on OSX, and setting up an Action Sequence where the output of one OpenWhisk Action is fed into the input of the next Action.
Install OpenWhisk via Vagrant
12345678
# Clone openwhisk
git clone --depth=1 https://github.com/apache/incubator-openwhisk.git openwhisk

# Change directory to tools/vagrant
cd openwhisk/tools/vagrant

# Run script to create vm and run hello action
./hello
I tried following the instructions on James Thomas’ blog for running Go within Docker, but ran into an error (see Disqus comment), and so here’s how I worked around it.
First create a simple Go program and cross compile it. Save the following to exec.go:
123456789101112131415161718192021
package main

import "encoding/json"
import "fmt"
import "os"

func main() {
  // native actions receive one argument, the JSON object as a string
  arg := os.Args[1]

  // unmarshal the string to a JSON object
  var obj map[string]interface{}
  json.Unmarshal([]byte(arg), &obj)
  name, ok := obj["name"].(string)
  if !ok {
      name = "Stranger"
  }
  msg := map[string]string{"msg": ("Hello, " + name + "!")}
  res, _ := json.Marshal(msg)
  fmt.Println(string(res))
}
Cross compile it for Linux:
1
env GOOS=linux GOARCH=amd64 go build exec.go
Pull the upstream Docker image:
1
docker pull openwhisk/dockerskeleton
Create a custom docker image based on openwhisk/dockerskeleton:
123
FROM openwhisk/dockerskeleton

COPY exec /action/exec
error: Binding creation failed: The supplied authentication is not authorized to access this resource. (code 751)
Switch to BlueMix
At this point I swiched to the OpenWhisk on Bluemix, and downloaded the wsk cli from the Bluemix website, and configure it with my api key per the instructions. Then I re-installed the action via:
You can get your Bluemix Org name (maybe the first part of your email address by default) and BlueMix space (dev by default) from the Bluemix web admin.
12
$ wsk property set --namespace myBluemixOrg_myBluemixSpace
ok: whisk namespace set to myBluemixOrg_myBluemixSpace
Create a new package binding pinned to a particular db
The /yournamespace/myCloudant/write action expects a dbname parameter, but the upstream fetch_aws_keys doesn’t contain that parameter. (and it’s better that it doesn’t, to reduce decoupling). So if you try to connect the two actions in a sequence at this point, it will fail.
]]><![CDATA[Running PostgreSQL in Docker]]>2017-06-14T08:01:00-07:00http://tleyden.github.io/blog/2017/06/14/running-postgresql-in-dockerThis walks you through:
Running Postgres locally in a docker container using docker networking (rather than the deprecated container links functionality that is mentioned in the Postgres Docker instructions.
$ docker run -it --rm --network postgres-network postgres psql -h postgres1 -U postgres
Password for user postgres: <enter password used earlier>
psql (9.6.3)
Type "help" for help.

postgres=#
You now have a working postgres database server.
Using a mounted volume for persistence
When running postgres under docker, most likely want to persist the database files on the host, rather than having them in the container.
First, remove the previous container with:
1
$ docker stop postgres1 && docker rm postgres1
Go into the /tmp directory:
1
$ cd /tmp
Launch a container and use /tmp/pgdata as the host directory to mount as a volume mount, which will be mounted in the container in /var/lib/postgresql/data, which is the default location where Postgres stores it’s data. The /tmp/pgdata directory will be created on the host if it doesn’t already exist.
List the contents of /tmp/pgdata and you should see several Postgres files:
12
$ ls pgdata/
PG_VERSION        pg_hba.conf     pg_serial       pg_twophase ...
Launch phppgadmin Container
First create a user
1
$ docker run -it --rm --network postgres-network postgres /bin/bash
Now you will be in a shell inside the docker container
1234
# createuser testuser -P --createdb -h postgres1 -U postgres
Enter password for new role: *******
Enter it again: ******
Password: <enter postgres password from earlier>
In your browser, open http://localhost:8080/ and you should see the phpadmin login screen:
Login with user/pass credentials created earlier:
username: testuser
password: **********
Deploying to Docker Cloud
Security warning! This is not a secure deployment and it’s not recommended to run this in production without a thorough audit by a security specialist.
]]><![CDATA[Understanding function closures in Go]]>2016-12-20T18:10:00-08:00http://tleyden.github.io/blog/2016/12/20/understanding-function-closures-in-goFunction closures are really powerful.
Essentially you can think of them like stateful functions, in the sense that they encapsulate state. The state that they happen to capture (or “close over” — hence the name “closure”) is everything that’s in scope when they are defined.
First some very basic higher order functions.
Higher order functions
Functions that take other functions and call them are called higher order functions. Here’s a trivial example:
In the main() function, we define a function called mySender and pass it to the sendLoop() function. sendLoop() takes a confusing looking argument called sender func() — the parameter name is sender, and the parameter type is func(), which is a function that takes no arguments and returns no values.
To make this slightly less confusing, we can define a named SenderFunc function type and use that:
1234567891011121314151617
// A SenderFunc is a function that takes no arguments, returns nothing
// and presumably sends something
type SenderFunc func()

func sendLoop(sender SenderFunc) {
  sender()
}

func main() {

  mySender := func() {
      fmt.Printf("I should send something\n")
  }

  sendLoop(mySender)

}
sendLoop() has been updated to take SenderFunc as an argument, which is easier to read than taking a func() as an argument (which looks a bit like a function call!) If the SenderFunc type took more parameters and/or returned more values, having this in a defined type would be crucial for readability.
Adding a return value
Let’s make it slightly more realistic — let’s say that the sendLoop() might need to retry calling the SenderFunc passed to it a few times until it actually works. So the SenderFunc definition will need to be updated so that it returns a boolean that indicates whether a retry is necessary.
123456789101112131415161718192021222324
// A SenderFunc is a function that takes no arguments and returns a boolean
// that indicates whether or not the send needs to be retried (in the case of failure)
type SenderFunc func() bool

func sendLoop(sender SenderFunc) {
  for {
      retry := sender()
      if !retry {
          return
      }
      time.Sleep(time.Second)
  }
}

func main() {

  mySender := func() bool {
      fmt.Printf("I should send something and return a real retry value\n")
      return false
  }

  sendLoop(mySender)

}
One thing to note here is the clean separation of concerns — all sendLoop() knows is that it gets a SenderFunc which it should call and it will return a boolean indicator of whether or not it worked or not. It knows absolutely nothing about the inner workings of the SenderFunc, nor does it care.
A stateful sender — the wrong way
You have a new requirement that you need to only retry the SenderFunc 10 times, and then you should give up.
Your first inclination might be to take this approach:
1234567891011121314151617181920212223242526272829
// A SenderFunc is a function that takes no arguments and returns a boolean
// that indicates whether or not the send needs to be retried (in the case of failure)
type SenderFunc func() bool

func sendLoop(sender SenderFunc) {
  counter := 0
  for {
      retry := sender()
      if !retry {
          return
      }
      counter += 1
      if counter >= 10 {
          return
      }
      time.Sleep(time.Second)
  }
}

func main() {

  mySender := func() bool {
      fmt.Printf("I should send something and return a real retry value\n")
      return false
  }

  sendLoop(mySender)

}
This will work, but it makes the sendLoop() less generally useful. What happens when your co-worker hears about this nifty sendLoop() you wrote, and wants to use it with their own SenderFunc but wants it to retry 100 times? (side note: your SenderFunc implementation simply prints to the console, whereas theirs might write to a Slack channel, yet the sendLoop() will still work!)
To make it more generic, you could take this approach:
12345678910111213141516171819202122232425
func sendLoop(sender SenderFunc, maxNumAttempts int) {
  counter := 0
  for {
      retry := sender()
      if !retry {
          return
      }
      counter += 1
      if counter >= maxNumAttempts {
          return
      }
      time.Sleep(time.Second)
  }
}

func main() {

  mySender := func() bool {
      fmt.Printf("I should send something and return a real retry value\n")
      return false
  }

  sendLoop(mySender, 10)

}
Which will work — but there’s a catch. Now that you’ve changed the method function signature of sendLoop() to take a second argument, all of the code that consumes sendLoop() will now be broken. If this were an exported function, it would be an even worse problem.
Luckily there is a much better way.
A stateful sender — the right way using function closures
Rather than making sendLoop() do the retry-related accounting and passing it parameters for that accounting, you can make the SenderFunc handle this and encapsulate the state via a function closure. In this case, the state is the number of retries that have been attempted, which will start at 0 and then increase on every call to the SenderFunc
How can SenderFunc keep internal state? It can “close over” any values that are in scope, which become associated with the function instance (I’m calling it an “instance” because it has state, as we shall see) and will be bound to the function instance as long as the function instance is around.
// A SenderFunc is a function that takes no arguments and returns a boolean
// that indicates whether or not the send needs to be retried (in the case of failure)
type SenderFunc func() bool

func sendLoop(sender SenderFunc) {
  for {
      retry := sender()
      if !retry {
          return
      }
      time.Sleep(time.Second)
  }
}

func main() {

  counter := 0              // internal state closed over and mutated by mySender function
  maxNumAttempts := 10      // internal state closed over and read by mySender function

  mySender := func() bool {
      sentSuccessfully := rand.Intn(5)
      if sentSuccessfully {
          return false // it worked, we're done!
      }

      // didn't work, any retries left?
      // only retry if we haven't exhausted attempts
      counter += 1
      return counter < maxNumAttempts

  }

  sendLoop(mySender)

}
The counter state variable is bound to the mySender function instance, which is able to update counter on every failed send attempt since the function “closes over” the counter variable that is in scope when the function instance is created. This is the heart of the idea of a function closure.
The sendLoop() doesn’t know anything about the internals of the SenderFunc in terms of how it tracks whether or not it should retry or not, it just treats it as a black box. Different SenderFunc implementations could use vastly different rules and/or states for deciding whether the sendLoop() should retry a failed send.
If you wanted to make it even more flexible, you could update the SenderFunc to return a time.Duration in addition to a bool to indicate retry, which would allow you to implement “backoff retry” strategies and so forth.
What about thread/goroutine safety?
If you’re passing the same function instances that have internal state (aka function closures) to multiple goroutines that are calling it, you’re going to end up causing data races. There’s nothing special about function closures that protect you from this.
The simplest way to deal with is to make a new function instance for each goroutine you are sending the function instance to, which is probably what you want. In theory though, you could also wrap the state update in a mutex, which is probably not what you want since that will cause goroutines to block eachother trying to grab the mutex.
]]><![CDATA[Tuning the Go HTTP client settings for load testing]]>2016-11-21T10:37:00-08:00http://tleyden.github.io/blog/2016/11/21/tuning-the-go-http-client-library-for-load-testingWhile working on a load testing tool in Go, I ran into a situation where I was seeing tens of thousands of sockets in the TIME_WAIT state.
Here are a few ways to get into this situation and how to fix each one.
Repro #1: Create excessive TIME_WAIT connections by forgetting to read the response body
Update the startLoadTest() method to add the following line of code (and related imports):
123456789101112
func startLoadTest() {
  for {
          ...
      if err != nil {
          panic(fmt.Sprintf("Got error: %v", err))
      }
      io.Copy(ioutil.Discard, resp.Body)  // <-- add this line
      resp.Body.Close()
                ...
  }

}
Now when you re-run it, calling netstat -n | grep -i 8080 | grep -i time_wait | wc -l while it’s running will return 0.
Repro #2: Create excessive TIME_WAIT connections by exceeding connection pool
Another way to end up with excessive connections in the TIME_WAIT state is to consistently exceed the connnection pool and cause many short-lived connections to be opened.
Here’s some code which starts up 100 goroutines which are all trying to make requests concurrently, and each request has a 50 ms delay:
To understand what’s going on, we’ll need to dig in a little deeper into the TIME_WAIT state.
What is the socket TIME_WAIT state anyway?
So what’s going on here?
What’s happening is that we are creating lots of short lived TCP connections, and the Linux kernel networking stack is keeping tabs on the closed connections to prevent certain problems.
The purpose of TIME-WAIT is to prevent delayed packets from one connection being accepted by a later connection. Concurrent connections are isolated by other mechanisms, primarily by addresses, ports, and sequence numbers[1].
Why so many TIME_WAIT sockets? What about connection re-use?
By default, the Golang HTTP client will do connection pooling. Rather than closing a socket connection after an HTTP request, it will add it to an idle connection pool, and if you try to make another HTTP request before the idle connection timeout (90 seconds by default), then it will re-use that existing connection rather than creating a new one.
This will keep the number of total socket connections low, as long as the pool doesn’t fill up. If the pool is full of established socket connections, then it will just create a new socket connection for the HTTP request and use that.
So how big is the connection pool? A quick look into transport.go tells us:
1234567891011
var DefaultTransport RoundTripper = &Transport{
        ...
  MaxIdleConns:          100,
  IdleConnTimeout:       90 * time.Second,
        ...
}

// DefaultMaxIdleConnsPerHost is the default value of Transport's
// MaxIdleConnsPerHost.
const DefaultMaxIdleConnsPerHost = 2
The MaxIdleConns: 100 setting sets the size of the connection pool to 100 connections, but with one major caveat: this is on a per-host basis. See the comments on the DefaultMaxIdleConnsPerHost below for more details on the implications of this.
The IdleConnTimeout is set to 90 seconds, meaning that after a connection stays in the pool and is unused for 90 seconds, it will be removed from the pool and closed.
The DefaultMaxIdleConnsPerHost = 2 setting below it. What this means is that even though the entire connection pool is set to 100, there is a per-host cap of only 2 connections!
In the above example, there are 100 goroutines trying to concurrently make requests to the same host, but the connection pool can only hold 2 sockets. So in the first “round” of the goroutines finishing their http request, 2 of the sockets will remain open in the pool, while the remaining 98 connections will be closed and end up in the TIME_WAIT state.
Since this is happening in a loop, you will quickly accumulate thousands or tens of thousands of connections in the TIME_WAIT state. Eventually, for that particular host at least, you will run out of ephemeral ports and not be able to open new client connections. For a load testing tool, this is bad news.
Fix: Tuning the http client to increase connection pool size
import (
     ..
)

var myClient *http.Client

func startWebserver() {
      ... same code as before

}

func startLoadTest() {
        ...
  for {
      resp, err := myClient.Get("http://localhost:8080/")  // <-- use a custom client with custom *http.Transport
                ... everything else is the same
  }

}


func main() {

  // Customize the Transport to have larger connection pool
  defaultRoundTripper := http.DefaultTransport
  defaultTransportPointer, ok := defaultRoundTripper.(*http.Transport)
  if !ok {
      panic(fmt.Sprintf("defaultRoundTripper not an *http.Transport"))
  }
  defaultTransport := *defaultTransportPointer // dereference it to get a copy of the struct that the pointer points to
  defaultTransport.MaxIdleConns = 100
  defaultTransport.MaxIdleConnsPerHost = 100

  myClient = &http.Client{Transport: &defaultTransport}

  // start a webserver in a goroutine
  startWebserver()

  for i := 0; i < 100; i++ {
      go startLoadTest()
  }

  time.Sleep(time.Second * 2400)

}
This bumps the total maximum idle connections (connection pool size) and the per-host connection pool size to 100.
Now when you run this and check the netstat output, the number of TIME_WAIT connections stays at 0
If you have higher concurrency requirements, you may want to bump this number to something higher than 100.
]]><![CDATA[Install Couchbase Server + Mobile on Docker Cloud]]>2016-10-31T16:28:00-07:00http://tleyden.github.io/blog/2016/10/31/install-couchbase-server-plus-mobile-on-docker-cloudDeploy Couchbase Server and Sync Gateway on Docker Cloud behind a load balancer.
Launch a node cluster with the following settings:
Provider: AWS
Region: us-east-1 (or whatever region makes sense for you)
VPC: Auto (if you don’t choose auto, you will need to customize your security group)
Type/Size: m3.medium or greater
IAM Roles: None
Create Couchbase Server service
Go to Services and hit the Create button:
Click the globe icon and Search Docker Hub for couchbase/server. You should select the couchbase/server image:
Hit the Select button and fill out the following values on the Services Wizard:
Service Name: couchbaseserver
Containers: 2
Deployment strategy: High Availability
Autorestart: On failure
Network: bridge
In the Ports section: Enable published on each port and set the Node Port to match the Container Port
Hit the Create and Deploy button. After a few minutes, you should see the Couchbase Server vervice running:
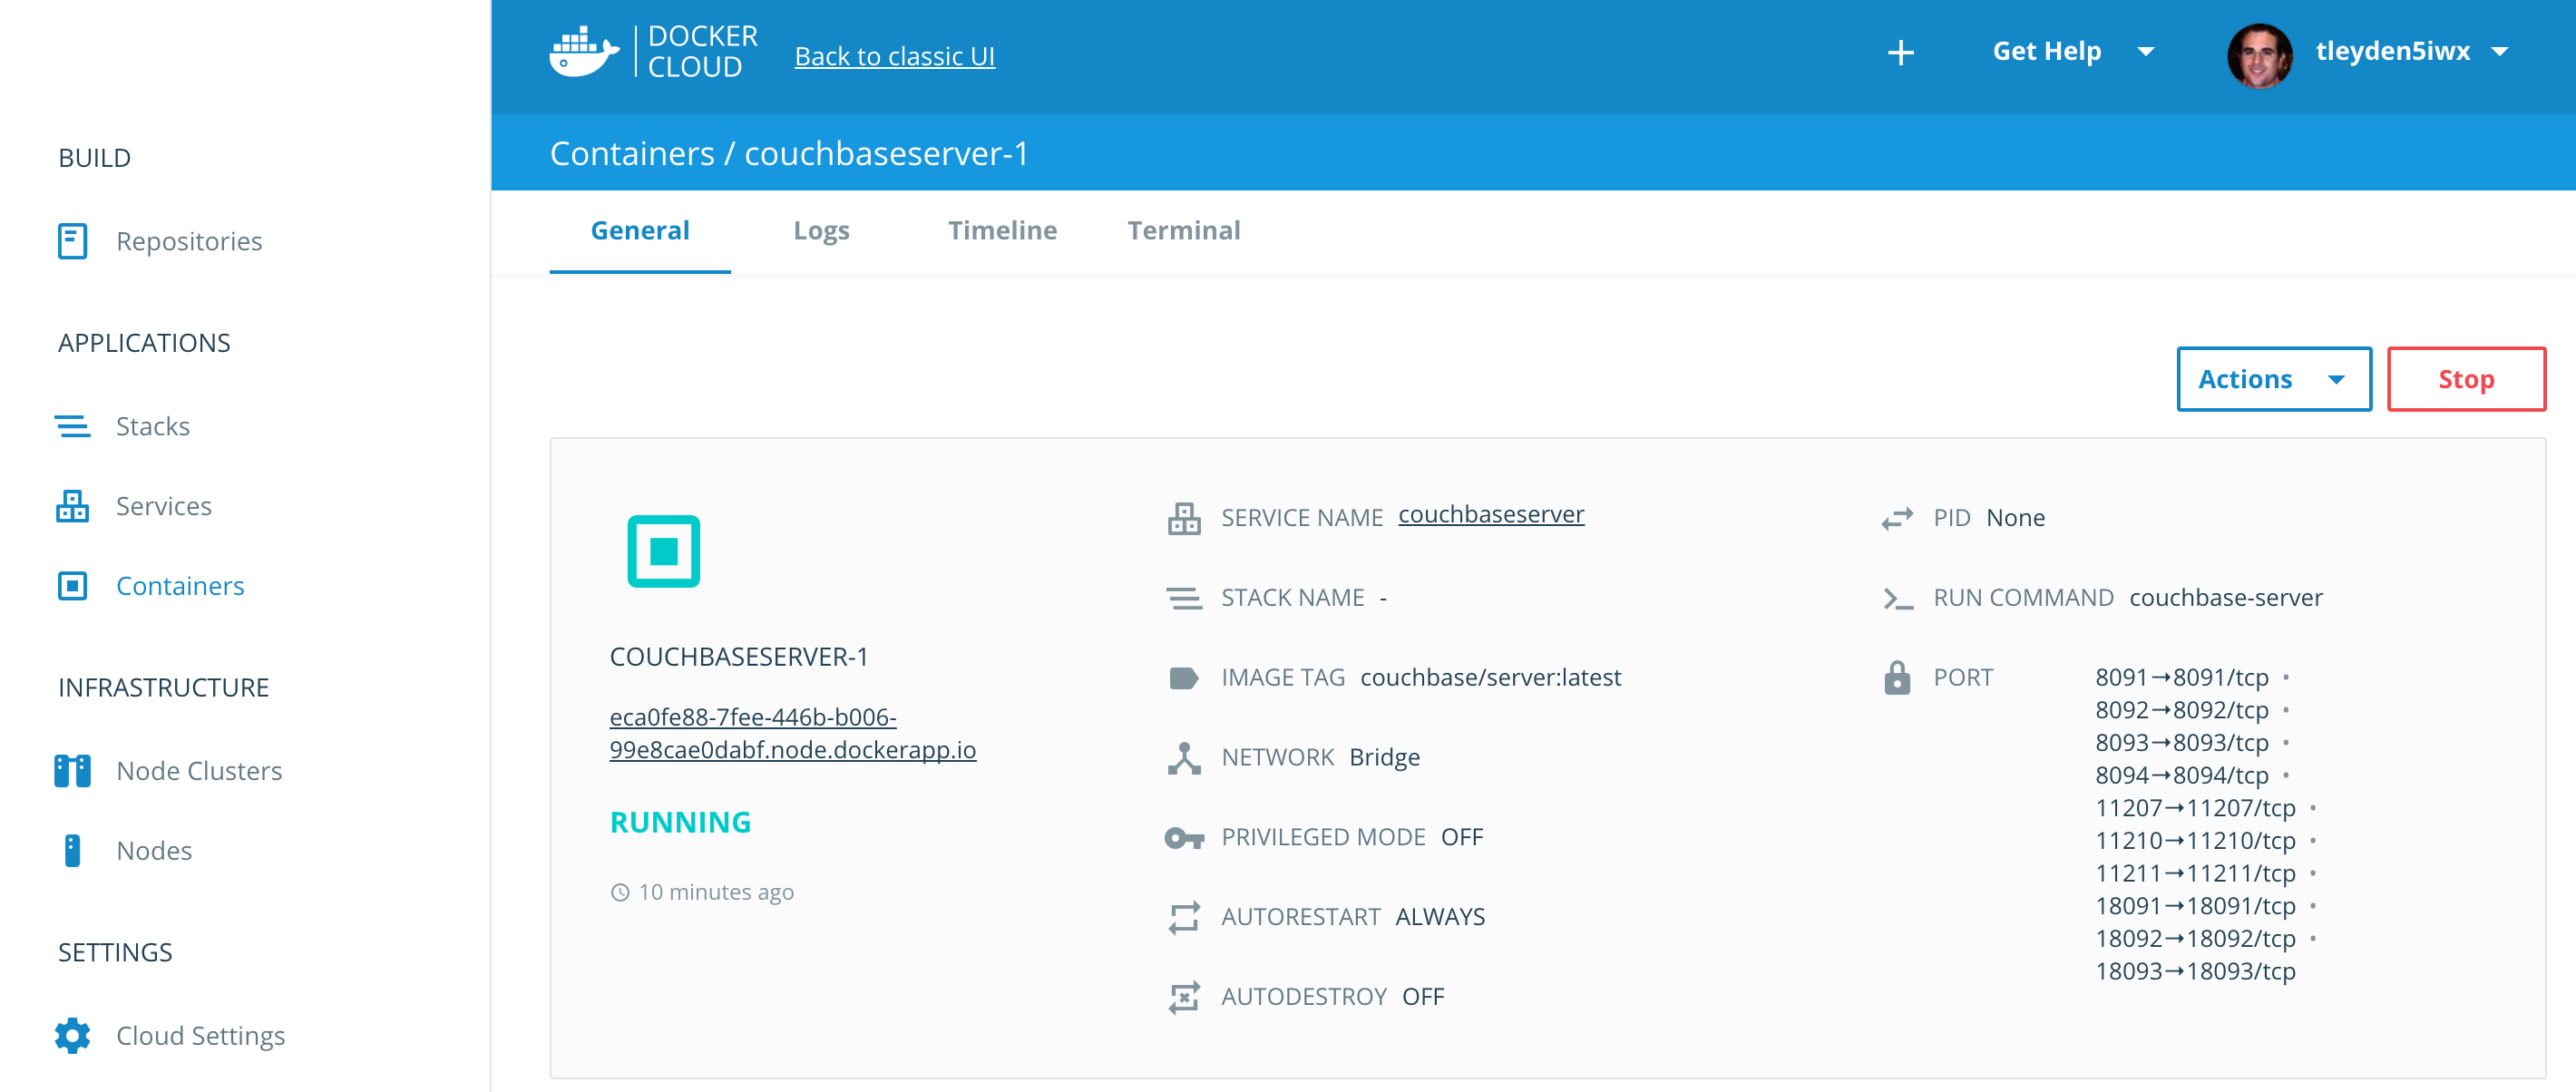
Configure Couchbase Server Container 1 + Create Buckets
Go to the Container section and choose couchbaseserver-1.
Copy and paste the domain name (eca0fe88-7fee-446b-b006-99e8cae0dabf.node.dockerapp.io) into your browser, adding 8091 at the end (eca0fe88-7fee-446b-b006-99e8cae0dabf.node.dockerapp.io:8091)
You should now see the Couchbase Server setup screen:
You will need to find the container IP of Couchbase Server in order to configure it. To do that, go to the Terminal section of Containers/couchbaseserver-1, and enter ifconfig.
Look for the ethwe1 interface and make a note of the ip: 10.7.0.2 — you will need it in the next step.
Switch back to the browser on the Couchbase Server setup screen. Leave the Start a new cluster button checked. Enter the 10.7.0.2 ip address (or whatever was returned for your ethwe1 interface) under the Hostname field.
and hit the Next button.
For the rest of the wizard, you can:
skip adding the samples
skip adding the default bucket
uncheck Update Notifications
leave Product Registration fields blank
check “I agree ..”
make sure to write down your password somewhere, otherwise you will be locked out of the web interface
Create a new bucket for your application:
Configure Couchbase Server Container 2
Go to the Container section and choose couchbaseserver-2.
As in the previous step, copy and paste the domain name (4d8c7be0-3f47-471b-85df-d2471336af75.node.dockerapp.io) into your browser, adding 8091 at the end (4d8c7be0-3f47-471b-85df-d2471336af75.node.dockerapp.io:8091)
Hit Setup and choose Join a cluster now with settings:
IP Address: 10.7.0.2 (the IP address you setup the first Couchbase Server node with)
Username: Administrator (unless you used a different username in the previous step)
Password: enter the password you used in the previous step
Configure Server Hostname: 10.7.0.3 (you can double check this by going to the Terminal for Containers/couchbaseserver-2 and running ifconfig and looking for the ip of the ethwe1 interface)
Trigger a rebalance by hitting the Rebalance button:
Sync Gateway Service
Now create a Sync Gateway service.
Before going through the steps in the Docker Cloud web UI, you will need to have a Sync Gateway configuration somewhere on the publicly accessible internet.
Warning: This is not a secure solution! Do not use any sensitive passwords if you follow these steps
To make it more secure, you could:
Use a Volume mount and have Sync Gateway read the configuration from the container filesystem
Use a HTTPS + Basic Auth for the URL that hosts the Sync Gateway configuration
Create a Sync Gateway configuration on a github gist and get the raw url for the gist.
Make sure to set the server value to http://couchbaseserver:8091 so that it can connect to the Couchbase Service setup in a previous step.
Use the bucket created in the Couchbase Server setup step above
In the Docker Cloud web UI, go to Services and hit the Create button again.
Click the globe icon and Search Docker Hub for couchbase/sync-gateway. You should select the couchbase/sync-gateway image.
Hit the Select button and fill out the following values on the Services Wizard:
Service Name: sync-gateway
Containers: 2
Deployment strategy: High Availability
Autorestart: On failure
Network: bridge
In the Container Configuration section, customize the Run Command to use the raw URL of your gist, eg: https://gist.githubusercontent.com/tleyden/f260b2d9b2ef828fadfad462f0014aed/raw/8f544be6b265c0b57848
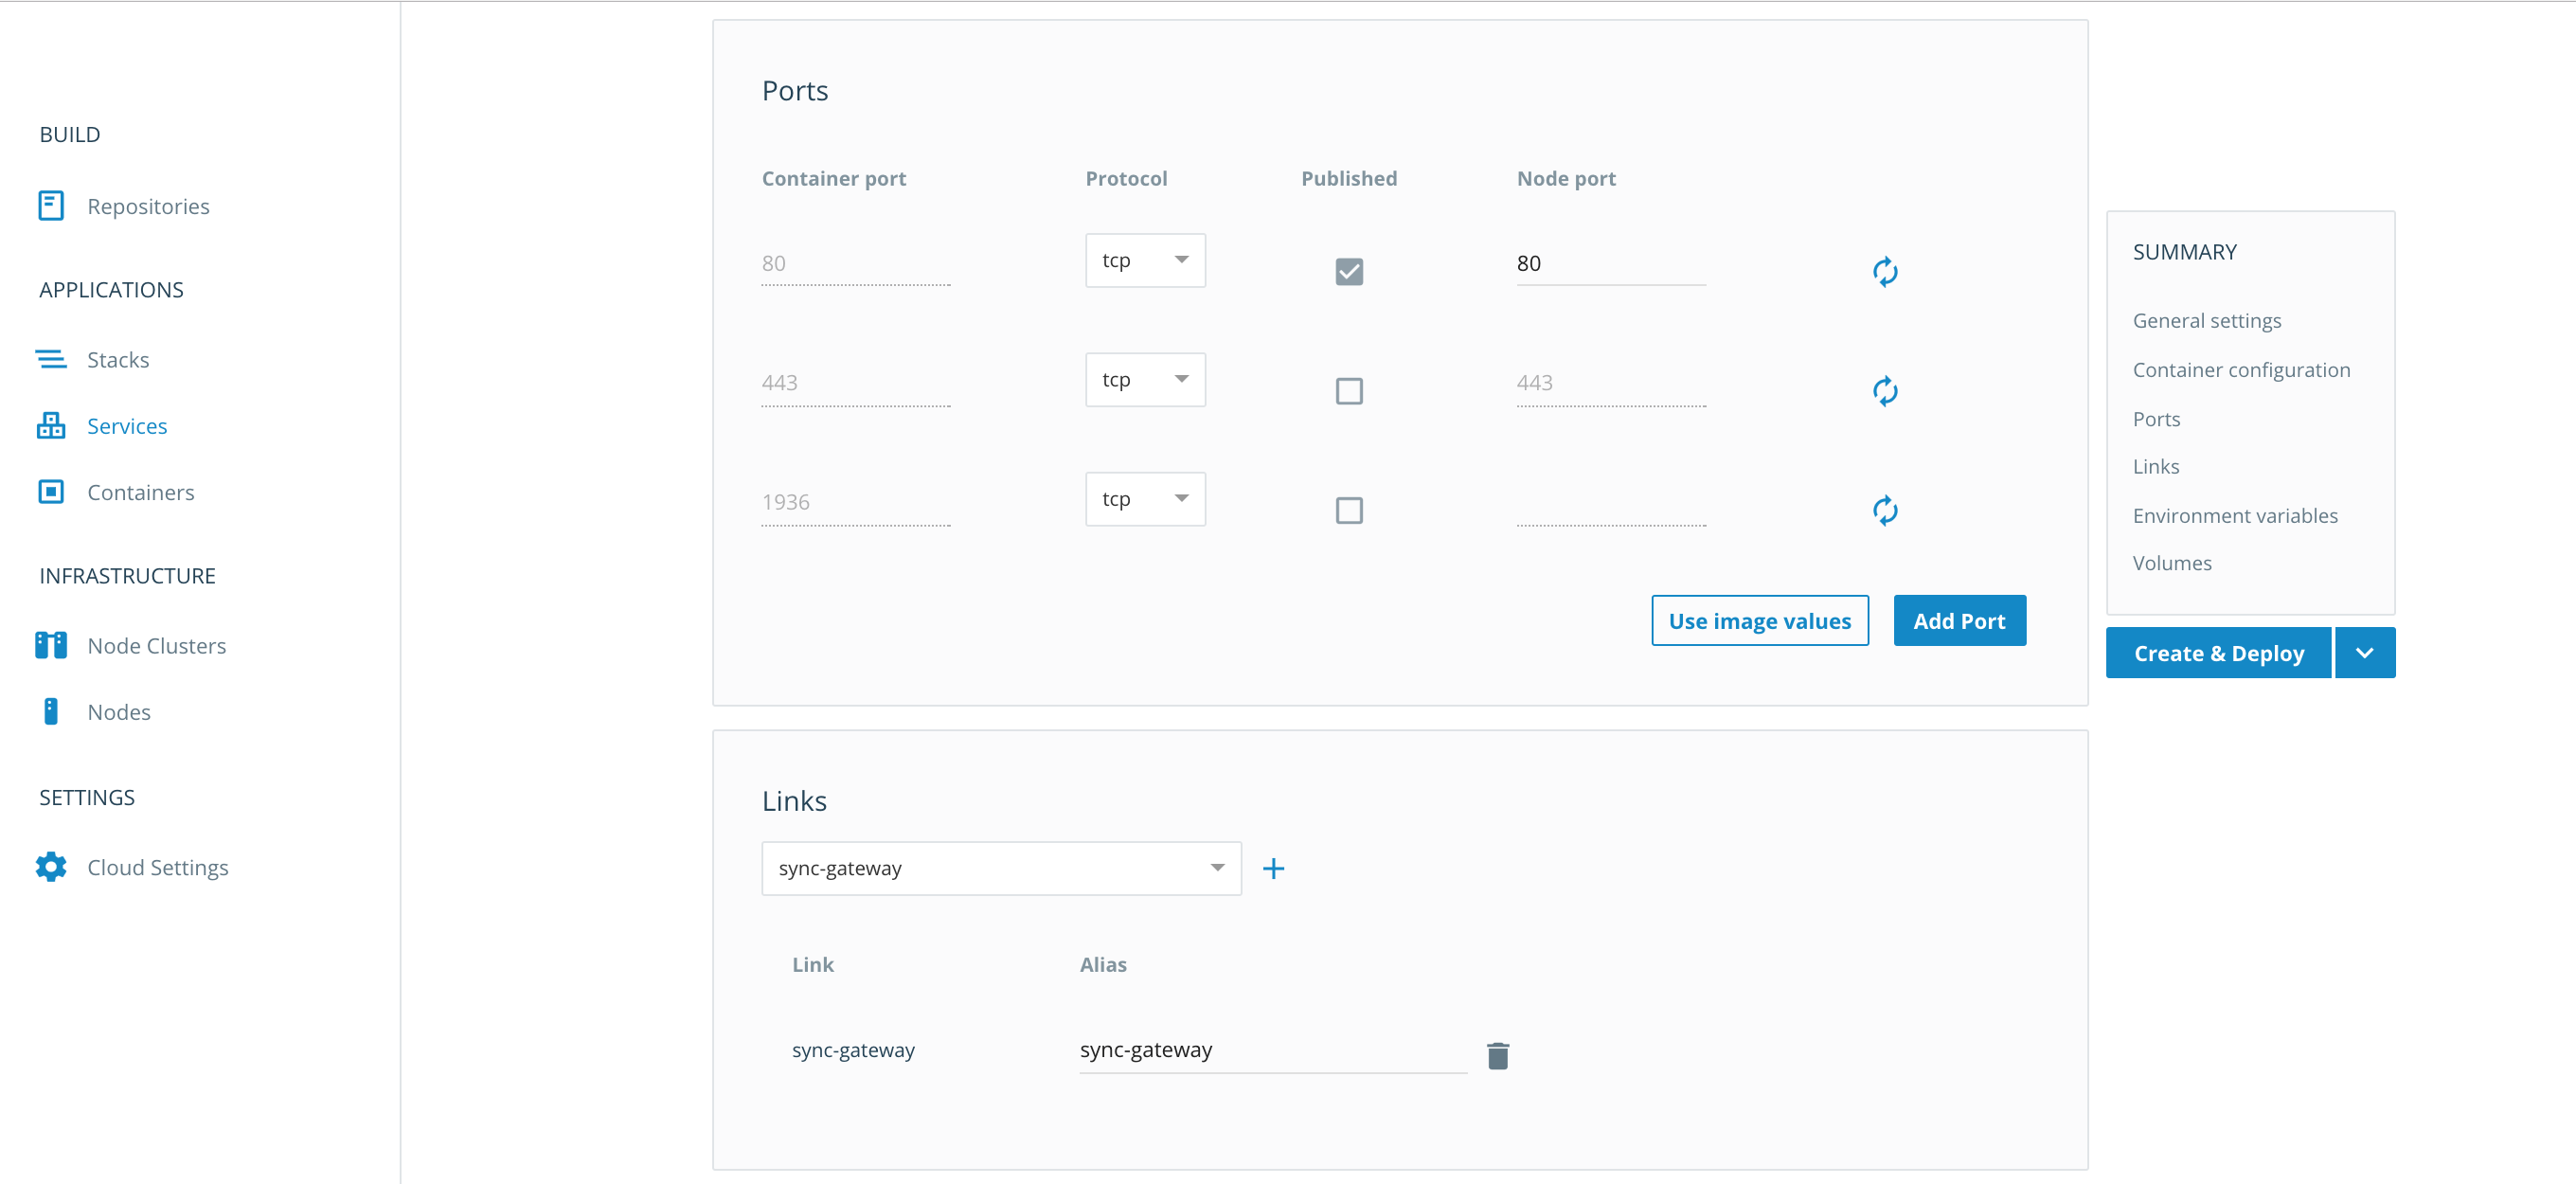
In the Ports section, use the following values:
In the Links section, choose couchbaseserver and hit the Plus button
Click the Create and Deploy button.
Verify Sync Gateway
Click the Containers section and you should have two Couchbase Server and two Sync Gateway containers running.
Click the sync-gateway-1 container and get the domain name (eca0fe88-7fee-446b-b006-99e8cae0dabf.node.dockerapp.io) and paste it in your browser with a trailing :4984, eg eca0fe88-7fee-446b-b006-99e8cae0dabf.node.dockerapp.io:4984
Congratulations! You have just setup a Couchbase Server + Sync Gateway cluster on Docker Cloud.
]]><![CDATA[Deep Dive of What Happens Under The Hood When You Open A Web Page]]>2016-10-02T12:50:00-07:00http://tleyden.github.io/blog/2016/10/02/deep-dive-of-what-happens-under-the-hood-when-you-open-a-web-pageThis is a continuation of What Happens Under The Hood When You Open A Web Page, and it’s meant to be a deeper dive.
Clients and Servers
Remember back in the day when you wanted to know what time it was, and you picked up your phone and dialed 853-1212 and it said “At the tone, the time will be 8:53 AM?”.
Those days are over, but the idea lives on. The time service is identical in principal to an internet server. You ask it something, and it gives you an answer.
A well designed service does one thing, and one thing well.
With the time service, you can only ask one kind of question: “What time is it?”
With a DNS server, you can only ask one kind of question: “What is the IP address of organic-juice-for-dogs.io”
Clients vs Servers:
A “Client” can essentially be thought of as being a “Customer”. In the case of calling the time, it’s the person dialing the phone number. In the case of DNS, it’s the Google Chrome browser asking for the IP address.
A “Server” can be thought of as being a “Service”. In the case of calling the time, it’s something running at the phone company. In the case of DNS, it’s a service run by a combination of universities, business, and governments.
Web Browsers
The following programs are all web browsers, which are all technically HTTP Clients, meaning they are on the client end of the HTTP tube.
Google Chrome
Safari
Firefox
Internet Explorer
Etc..
What web browsers do:
Lookup IP addresses from DNS servers over the DNS protocol (which in turn sits on top of the UDP protocol)
Retrieve web pages, images, and more from web servers over the HTTP protocol (which in turn sits on top of the TCP protocol)
Render HTML into formatted “pages”
Executes JavaScript code to add a level of dynamic behavior to web pages
Protocols
In the previous post, there were a few “protocols” mentioned, like HTTP.
What are protocols really?
Any protocol is something to make it possible for things that speak the same protocol to speak to each other over that protocol.
A protocol is just a language, and just like everyone in English-speaking countries agree to speak English and can therefore intercommunicate without issues, many things on the internet agree to speak HTTP to each other.
Here’s what a conversation looks like in the HTTP protocol:
12
HTTP Client: GET /
HTTP Server: <html>I'm a <blink>amazing</blink> HTML web page!!</html>
Almost everything that happens on the Internet looks something like this:
You can think of the internet as being made up of tubes. Two very common types of tubes are:
TCP (Transmission Control Protocol)
UDP (User Datagram Protocol)
Here’s what you might imagine an internet tube looking like:
IP
Really, you can think of TCP and UDP as internet tubes that are built from the same kind of concrete — and that concrete is called IP (Internet Protocol)
TCP wraps IP, in the sense that it is built on top of IP. If you took a slice of a TCP internet tube, it would look like this:
IP, or “Internet Protocol”, is fancy way of saying “How machines on the Internet talk to each other”, and IP addresses are their equivalent of phone numbers.
Why do we need two types of tubes built on top of IP? They have different properties:
TCP tubes are heavy weight, they take a long time to build, and a long time to tear down, but they are super reliable.
UDP tubes are light weight, and have no guarantees. They’re like the ¯\_(ツ)_/¯ of internet tubes. If you send something down a UDP internet tube, you actually have no idea whether it will make it down the tube or not. It might seem useless, but it’s not. Pretty much all real time gaming, voice, and video transmissions go through UDP tubes.
HTTP tubes
If you take a slice of an HTTP tube, it looks like this:
          ┌────────────────────┐
          │                    │
          │       Chrome       │
          │       Browser      │
          │                    │
          └─────────┬────▲─────┘
                    │    │
                    │    │
          ┌─────────▼────┴─────┐
          │                    │
          │   Some random      │
          │  computer in WA    │
          │                    │
          └─────────┬─────▲────┘
          ┌─────────▼─────┴────┐
          │                    │
          │   Some random      │
          │  computer in IL    │
          │                    │
          └────────┬───▲───────┘
          ┌────────▼───┴───────┐
          │                    │
          │   Some random      │
          │  computer in MA    │
          │                    │
          └──────────┬───▲─────┘
                     │   │
                     │   │
                     │   │
 Send me the HTML    │   │ <html>stuff</html>
                     │   │
                     │   │
                     │   │
                     │   │
          ┌──────────▼───┴─────┐
          │                    │
          │    HTTP Server     │
          │                    │
          └────────────────────┘
Each of these random computers in between are called routers, and they basically shuttle traffic across the internet. They make it possible that any two computers on the internet can communicate with each other, without having a direct connection.
If you’re curious to know which computers are in the middle of your connection between you and another computer on the internet, you can run a nifty little utility called traceroute:
1234567891011121314
$ traceroute google.com
traceroute to google.com (172.217.5.110), 64 hops max, 52 byte packets
 1  dd-wrt (192.168.11.1)  1.605 ms  1.049 ms  0.953 ms
 2  96.120.90.157 (96.120.90.157)  9.334 ms  8.796 ms  8.850 ms
 3  te-0-7-0-18-sur03.oakland.ca.sfba.comcast.net (68.87.227.209)  9.744 ms  9.416 ms  9.120 ms
 4  162.151.78.93 (162.151.78.93)  12.310 ms  11.559 ms  11.662 ms
 5  be-33651-cr01.sunnyvale.ca.ibone.comcast.net (68.86.90.93)  11.276 ms  11.187 ms  12.426 ms
 6  hu-0-13-0-1-pe02.529bryant.ca.ibone.comcast.net (68.86.84.14)  11.624 ms
    hu-0-12-0-1-pe02.529bryant.ca.ibone.comcast.net (68.86.87.14)  11.637 ms
    hu-0-13-0-0-pe02.529bryant.ca.ibone.comcast.net (68.86.86.94)  12.404 ms
 7  as15169-3-c.529bryant.ca.ibone.comcast.net (23.30.206.102)  11.024 ms  11.498 ms  11.148 ms
 8  108.170.243.1 (108.170.243.1)  11.037 ms
    108.170.242.225 (108.170.242.225)  12.246 ms
    108.170.243.1 (108.170.243.1)  11.482 ms
So from my computer to the computer at google.com, it goes through all of those intermediate computers. Some have DNS names, like be-33651-cr01.sunnyvale.ca.ibone.comcast.net, but some only have IP addresses, like 162.151.78.93
Any one of those computers could sniff the traffic going through the tubes (even the IP tubes that all the other ones sit on top of!). That’s one of the reasons you don’t want to send your credit cards over the internet without using encryption.
The End
]]><![CDATA[What happens under the hood when you open a web page?]]>2016-09-30T20:25:00-07:00http://tleyden.github.io/blog/2016/09/30/the-lifecycle-of-an-http-requestFirst, the bird’s eye view:
┌────┐                   ┌────────────────┐               ┌────────────────┐
│You │                   │ Google Chrome  │               │    Internet    │
└────┘                   └────────────────┘               └────────────────┘
 │                               │                                  │
 │    Show me the website for    │                                  │
 │───organic-juice-for-dogs.io──▶│       1. Hey what's the IP of    │
 │                               │─────organic-juice-for-dogs.io?──▶│
 │                               │                                  │
 │                               │                                  │
 │                               │◀───────────63.120.10.5───────────│
 │                               │                                  │
 │                               │                                  │
 │                               │        2. HTTP GET / to          │
 │                               │───────────63.120.10.5───────────▶│
 │                               │                                  │
 │                               │                                  │
 │                               │     HTML Content for homepage    │
 │                               │◀───────────────of ───────────────│
 │                               │     organic-juice-for-dogs.io    │
 │                               │                                  │
 │                               │                                  │
 │         3. Render HTML into   │                                  │
 │◀────────────a Web Page────────│                                  │
 │                               │                                  │
 │                               │                                  │
 │      Click stuff in Google    │                                  │
 │─────────────Chrome───────────▶│                                  │
 │                               │                                  │
 │                               │                                  │
 │         4. Execute JavaScript │                                  │
 │◀─────────and update Web Page──┤                                  │
 │                               │                                  │
 ▼                               ▼                                  ▼
It all starts with a DNS lookup.
Step 1. The DNS Lookup
Your Google Chrome software contacts a server on the Internet called a DNS server and asks it “Hey what’s the IP of organic-juice-for-dogs.io?”.
DNS has an official sounding acronym, and for good reason, because it’s a very authoritative and fundamental Internet service.
So what exactly is DNS useful for?
It transforms Domain names into IP addresses
123456789101112
 ┌────────────────────┐                                     ┌────────────────────┐
 │                    │      What's the IP address of       │                    │
 │                    │─────organic-juice-for-dogs.io?──────▶                    │
 │                    │                                     │                    │
 │       Chrome       │                                     │      DNS Server    │
 │       Browser      ◀───────────63.120.10.5───────────────│                    │
 │                    │                                     │                    │
 │                    │                                     │                    │
 │                    │                                     │                    │
 └────────────────────┘                                     └────────────────────┘
A Domain name, also referred to as a “Dot com name”, is an easy-to-remember word or group of words, so people don’t have to memorize a list of meaningless numbers. You could think of it like dialing 1-800-FLOWERS, which is a lot easier to remember than 1-800-901-1111
The IP address 63.120.10.5 is just like a phone number. If you are a human being and want to call someone, you might dial 415-555-1212. But if you’re a thing on the internet and you want to talk to another thing on the internet, you instead dial the IP address63.120.10.5 — same concept though.
So, that’s DNS in a nutshell. Not very complicated on the surface.
Step 2. Contact the IP address and fetch the HTML over HTTP
In this step, Google Chrome sends an HTTP GET / HTTP request to the HTTP Server software running on a computer somewhere on the Internet that has the IP address 63.120.10.5.
You can think of the GET / as “Get me the top-most web page from the website”. This is known as the root of the website, in contrast to things deeper into the website, like GET /juices/oakland, which might return a list of dog juice products local to Oakland, CA. Since the root is a the top, that means the tree is actually upside down, and folks tend to think of websites as being structured as inverted trees.
The back-and-forth is going to look something like this:
These things are speaking HTTP to each other. What is HTTP?
You can think of things that communicate with each other over the internet as using tubes. There are lots of different types of tubes, and in this case it’s an HTTP tube. As long as the software on both ends agree on the type of tube they’re using, everything just works and they can send stuff back and forth. HTTP is a really common type of tube, but it’s not the only one — for example the DNS lookup in the previous step used a completely different type of tube.
Usually the stuff sent back from the HTTP Server is something called HTML, which stands for HyperText Markup Language.
But HTML is not the only kind of stuff that can be sent through an HTTP tube. In fact, JSON (Javascript Object Notation) and XML (eXtensible Markup Language) are also very common. In fact there are tons of different types of things that can be sent through HTTP tubes.
So at this point in our walk through, the Google Chrome web browser software has some HTML text, and it needs to render it in order for it to appear on your screen in a nice easy to view format. That’s the next step.
Step 3. Render HTML in a Web page
HTML is technically a markup language, which means that the text contains formatting directives which has an agreed upon standard on how it should be formatted. You can think of HTML as being similar to a Microsoft Word document, but MS Word is obfuscated while HTML is very transparent and simple:
For example, here is some HTML:
1234567
<html>
   <Header>My first web page, circa, 1993!</Header>
   <Paragraph>
        I am so proud to have made my very first web page, I <blink>Love</blink> the World Wide Web
   <Paragraph>
   <Footer>Best Viewed on NCSA Mosaic</Footer>
</html>
Which gets rendered into:
So, you’ll notice that the <Header> element is in a larger font. And the <Paragraph> has spaces in between it and the other text.
How does the Google Chrome Web Browser do the rendering? It’s just a piece of software, and rendering HTML is one of it’s primary responsibilities. There are tons of poor engineers at Google who do nothing all day but fix bugs in the Google Chrome rendering code.
Of course, there’s a lot more to it, but that’s the essence of rendering HTML into a web page.
Step 4: Execute JavaScript in your Google Chrome Web Browser
So this step is optional because not all web pages will execute JavaScript in your web browser software, however it’s getting more and more common these days. When you open the Gmail website in your browser, it’s running tons of Javascript code to make the website as fast and responsive as possible.
Essentially, JavaScript adds another level of dynamic abilities to HTML, because when the browser is given HTML and it renders it .. that’s it! There’s no more action, it just sits there — it’s completely inert.
JavaScript, on the other hand, is basically a program-within-a-program.
123456789101112131415161718
 ┌───────────────────────────────────────────────────────────────┐
 │                         Google Chrome                         │
 │           (A program written in C++ you downloaded)           │
 │                                                               │
 │                                                               │
 │      ┌──────────────────────────────────────────────────┐     │
 │      │                                                  │     │
 │      │                                                  │     │
 │      │     JavaScript for organic-juice-for-dogs.io     │     │
 │      │  (A program in JavaScript that snuck in via the  │     │
 │      │                  HTML document)                  │     │
 │      │                                                  │     │
 │      │                                                  │     │
 │      └──────────────────────────────────────────────────┘     │
 │                                                               │
 │                                                               │
 └───────────────────────────────────────────────────────────────┘
How does the JavaScript get to the web browser? It sneaks in over the HTML! It’s embedded in the HTML, since it’s just another form of text, and your Web Browser (Google Chrome) executes it.
12345678
<html>
     <Javascript>
          if (Paragraph == CLICKED) {
              Window.Alert("YOU MAY BE INFECTED BY A VIRUS, CLICK HERE IMMEDIATELY")
    }
     </Javascript>
    ...
</html>
What can JavaScript do exactly? The list is really, really long. But as a simple example, if you click a button on a webpage:
A JavasScript program can pop up a little “Alert Box”, like this:
Done!
And that’s the World Wide Web! You just went from typing a URL in your browser, from a shiny web page in your Google Chrome. Soup to nuts.
]]><![CDATA[Configuring InfluxDB and Grafana with Go client library]]>2016-09-12T15:14:00-07:00http://tleyden.github.io/blog/2016/09/12/configuring-influxdb-and-grafana-with-go-client-libraryCreate a beautiful Grafana dashboard with realtime performance stats:
The Grafana Web UI should be available at localhost:3000 — login with admin/admin
The InfluxDB Web UI should be available at localhost:8083
Create database on influx
Create db named “db”
12
$ influx
> create database db
Edit telegraf conf
Open /usr/local/etc/telegraf.conf in your favorite text editor and uncomment the entire statsd server section:
123456
# Statsd Server
[[inputs.statsd]]
  ## Address and port to host UDP listener on
  service_address = ":8125"

  .. etc ..
Set the database to use the “db” database created earlier, under the outputs.influxdb section of the telegraf config
12345678
[[outputs.influxdb]]
  ## The full HTTP or UDP endpoint URL for your InfluxDB instance.
  ## Multiple urls can be specified as part of the same cluster,
  ## this means that only ONE of the urls will be written to each interval.
  # urls = ["udp://localhost:8089"] # UDP endpoint example
  urls = ["http://localhost:8086"] # required
  ## The target database for metrics (telegraf will create it if not exists).
  database = "db" # required
Restart telegraf
1
brew services restart telegraf
Create Grafana Data Source
Open the Grafana Web UI in your browsers (login with admin/admin)
Use the following values:
Create Grafana Dashboard
Go to Dashboards / + New
Click the green thing on the left, and choose Add Panel / Graph
Delete the test metric, which is not needed, by clicking the trash can to the right of “Test Metric”
Under Panel / Datasource, choose db, and then hit + Add Query, you will end up with this
Push sample data point from command line
In order for the field we want to show up on the grafana dashboard, we need to push some data points to the telegraf statds daemon.
Run this in a shell to push the foo:1|c data point, which is a counter with value increasing by 1 on the key named “foo”.
1
while true; do echo "foo:1|c" | nc -u -w0 127.0.0.1 8125; sleep 1; echo "pushed data point"; done
Create Grafana Dashboard, Part 2
Under select measurement, choose foo from the pulldown
On the top right of the screen near the clock icon, choose “Last 5 minutes” and set Refreshing every to 5 seconds
You should see your data point counter being increased!
Add Go client library and push data points
Here’s how to update to your golang application to push new datapoints.
This will push statsd “timing” data points under the key “open_website”, with the normal sample rate (set to 0.1 to downsample and only take every 10th sample). Run the code in a loop and it will start pushing stats to statsd.
Now, create a new Grafana dashboard with the steps above, but from the select measurement field choose open_website, and under SELECT choose field (mean) instead of field (value).
]]><![CDATA[Go race detector gotcha with value receivers]]>2016-05-19T23:06:00-07:00http://tleyden.github.io/blog/2016/05/19/go-race-detector-gotcha-with-value-receiversI ran into the following race detector error:
123456789101112
WARNING: DATA RACE
Write by goroutine 44:
  github.com/couchbaselabs/sg-replicate.stateFnActiveFetchCheckpoint()
      /Users/tleyden/Development/gocode/src/github.com/couchbaselabs/sg-replicate/replication_state.go:53 +0xb1d
  github.com/couchbaselabs/sg-replicate.(*Replication).processEvents()
      /Users/tleyden/Development/gocode/src/github.com/couchbaselabs/sg-replicate/synctube.go:120 +0xa3

Previous read by goroutine 27:
  github.com/couchbaselabs/sg-replicate.(*Replication).GetStats()
      <autogenerated>:24 +0xef
  github.com/couchbase/sync_gateway/base.(*Replicator).populateActiveTaskFromReplication()
      /Users/tleyden/Development/gocode/src/github.com/couchbase/sync_gateway/base/replicator.go:241 +0x145
It didn’t make sense, because they were accessing different fields of the Replication — one was writing to r.EventChan while the other was reading from r.Stats.
I started wandering around the Couchbase office looking for help, and got Steve Yen to help me.
He was asking me about using a pointer receiver vs a value receiver here, and then we realized that by using a value reciever it was copying all the fields, and therefore reading all of the fields, including the r.EventChan field that the other goroutine was concurrently writing to! Hence, the data race that was subtly caused by using a value receiver..
The fix was to convert this over to a pointer reciever, and the data race disappeared!
]]><![CDATA[Setting up a self-hosted drone.io CI server]]>2016-02-15T19:37:00-08:00http://tleyden.github.io/blog/2016/02/15/setting-up-a-self-hosted-drone-dot-io-ci-serverSpin up AWS server
Ubuntu Server 14.04 LTS (HVM), SSD Volume Type – ami-fce3c696
Check the logs via docker logs <container-id> and they should look something like this
Edit AWS security group
With your instance selected, look for the security groups in the instance details:
Add a new inbound port with the following settings:
Protocol TCP
Port Range 80
Source 0.0.0.0
It should look like this when you’re done:
Verify it’s running
Paste the hostname of your aws instance into your browser (eg, http://ec2-54-163-185-45.compute-1.amazonaws.com), and you should see a page like this:
Login
If you click the login button, you should see:
And then:
Activate a repository
Click one of the repositories you have access to, and you should get an “activate now” option:
which will take you to your project home screen:
Add a .drone.yml file to the root of the repository
In the repository you have chosen (in my case I’m using tleyden/sync_gateway, which is a golang project, and may refer to it later), add a .drone.yml file to the root of the repository with:
123456
build:
image: golang
commands:
- go get
- go build
- go test
Commit your change, but do not push to github yet, that will be in the next step.
and in your drone UI you should see a build in progress:
when it finishes, you’ll see either a pass or a failure. If you get a failure (which I did), it will look like this:
Manually triggering another build
In my case, the above failure was due to a dependency not building. Since nothing else needs to be pushed to the repo to fix the build, I’m just going to manually trigger a build.
On the build failure screen above, there is a Restart button, which triggers a new build.
Now it works!
Setup the Drone CLI
I could run this on my OSX workstation, but I decided to run this on a linux docker container. The rest of the steps assume you have spun up and are inside a linux docker container.
To test the CLI tool works, try the following commands:
12345
# drone repo ls
couchbase/sync_gateway
tleyden/sync_gateway
# drone repo info tleyden/sync_gateway
tleyden/sync_gateway
]]><![CDATA[Adding vendoring to a Go project]]>2016-02-08T22:49:00-08:00http://tleyden.github.io/blog/2016/02/08/adding-vendoring-to-a-go-projectInstall gvt
After doing some research, I decided to try gvt since it seemed simple and well documented, and integrated well with exiting tools like go get.
12
$ export GO15VENDOREXPERIMENT=1
$ go get -u github.com/FiloSottile/gvt
Go get target project to be updated
I’m going to update todolite-appserver to use vendored dependencies for some of it’s dependencies, just to see how things go.
1
$ go get -u github.com/tleyden/todolite-appserver
Vendor dependencies
I’m going to vendor the dependency on kingpin since it has transitive dependencies of it’s own (github.com/alecthomas/units, etc). gvt handles this by automatically pulling all of the transitive dependencies.
Also, I updated the README to tell users to set the GO15VENDOREXPERIMENT=1 variable:
123
$ export GO15VENDOREXPERIMENT=1
$ go get -u github.com/tleyden/todolite-appserver
$ todolite-appserver --help
but the instructions otherwise remained the same. If someone tries to use this but forgets to set GO15VENDOREXPERIMENT=1 in Go 1.5, it will still work, it will just use the kingpin dependency in the $GOPATH rather than the vendor/ directory. Ditto for someone using go 1.4 or earlier.
Removing a vendored dependency
As it turns out, I don’t even need kingpin in this project, since I’m using cobra. The kingpin dependency was caused by some leftover code I forgot to cleanup.
In this case, since it was my only dependency, it was easy to identify the transitive dependencies. In general though it looks like it’s up to you as a user to track down which ones to remove. I filed gvt issue 16 to hopefully address that.
Editor annoyances
I have emacs setup using the steps in this blog post, and I’m running into the following annoyances:
When I use godef to jump into the code of vendored dependency, it takes me to source code that lives in the GOPATH, which might be different than what’s under vendor/. Also, if I edit it there, my changes won’t be reflected when I rebuild.
I usually search for things in the project via M-x rgrep, but now it’s searching through every repo under vendor/ and returning things I’m not interested in .. since most of the time I only want to search within my project.
]]><![CDATA[Configure Emacs as a Go Editor From Scratch Part 3]]>2016-02-07T04:25:00-08:00http://tleyden.github.io/blog/2016/02/07/configure-emacs-as-a-go-editor-from-scratch-part-3This is a continuation from a previous blog post. In this post I’m going to focus on making emacs look a bit better.
Currently:
Install a nicer theme
I like the taming-mr-arneson-theme, so let’s install that one. Feel free to browse the emacs themes and find one that you like more.
]]><![CDATA[Octopress under Docker]]>2016-02-06T05:38:00-08:00http://tleyden.github.io/blog/2016/02/06/octopress-under-dockerI’m setting up a clean install of El Capitan, and want to get my Octopress blog going. However, I don’t want to install it directly on my OSX workstation — I want to have it contained in a docker container.
Install Docker
That’s beyond the scope of this blog post, but what I ended up doing on my new OSX installation was to:
$ docker run -itd -v ~/Documents/blog/:/blog tleyden5iwx/octopress /bin/bash
What’s in ~/Documents/blog/? Basically, the octopress instance I’d setup as described in Octopress Setup Part I.
Bundle install
From inside the docker container:
12
# cd /blog/octopress
# bundle install
Edit a blog post
On OSX, open up ~/Documents/blog/source/_posts/path-to-post and make some minor edits
Push source
123
# git push origin source
Username for 'https://github.com': [enter your username]
Password for 'https://username@github.com': [enter your password]
Generate and push to master
Attempt 1
12345
# rake generate
rake aborted!
Gem::LoadError: You have already activated rake 10.4.2, but your Gemfile requires rake 0.9.6. Using bundle exec may solve this.
/blog/octopress/Rakefile:2:in `<top (required)>'
(See full trace by running task with --trace)
I have no idea why this is happening, but I just conceded defeat against these ruby weirdisms, wished I was using Go (and thought about converting my blog to Hugo), and took their advice and prefixed every command thereafter with bundle exec.
Attempt 2
123
# bundle exec rake generate && bundle exec rake deploy
Username for 'https://github.com': [enter your username]
Password for 'https://username@github.com': [enter your password]
Success!
]]><![CDATA[Setting up Uniqush with APNS]]>2016-02-03T08:47:00-08:00http://tleyden.github.io/blog/2016/02/03/setting-up-uniqush-with-apnsThis walks you through running Uniqush in the cloud (under Docker) and setting up an iOS app to receive messages via APNS (Apple Push Notification Service).
Security note: the above config has Uniqush listening on all interfaces, but depending on your setup you probably want to change that to localhost or something more restrictive.
Docker compose file
Copy and paste this content into docker-compose.yml
Run this curl command outside of the docker container to verify that Uniqush is responding to HTTP requests:
12
$ curl localhost:9898/version
uniqush-push 1.5.2
Create APNS certificate
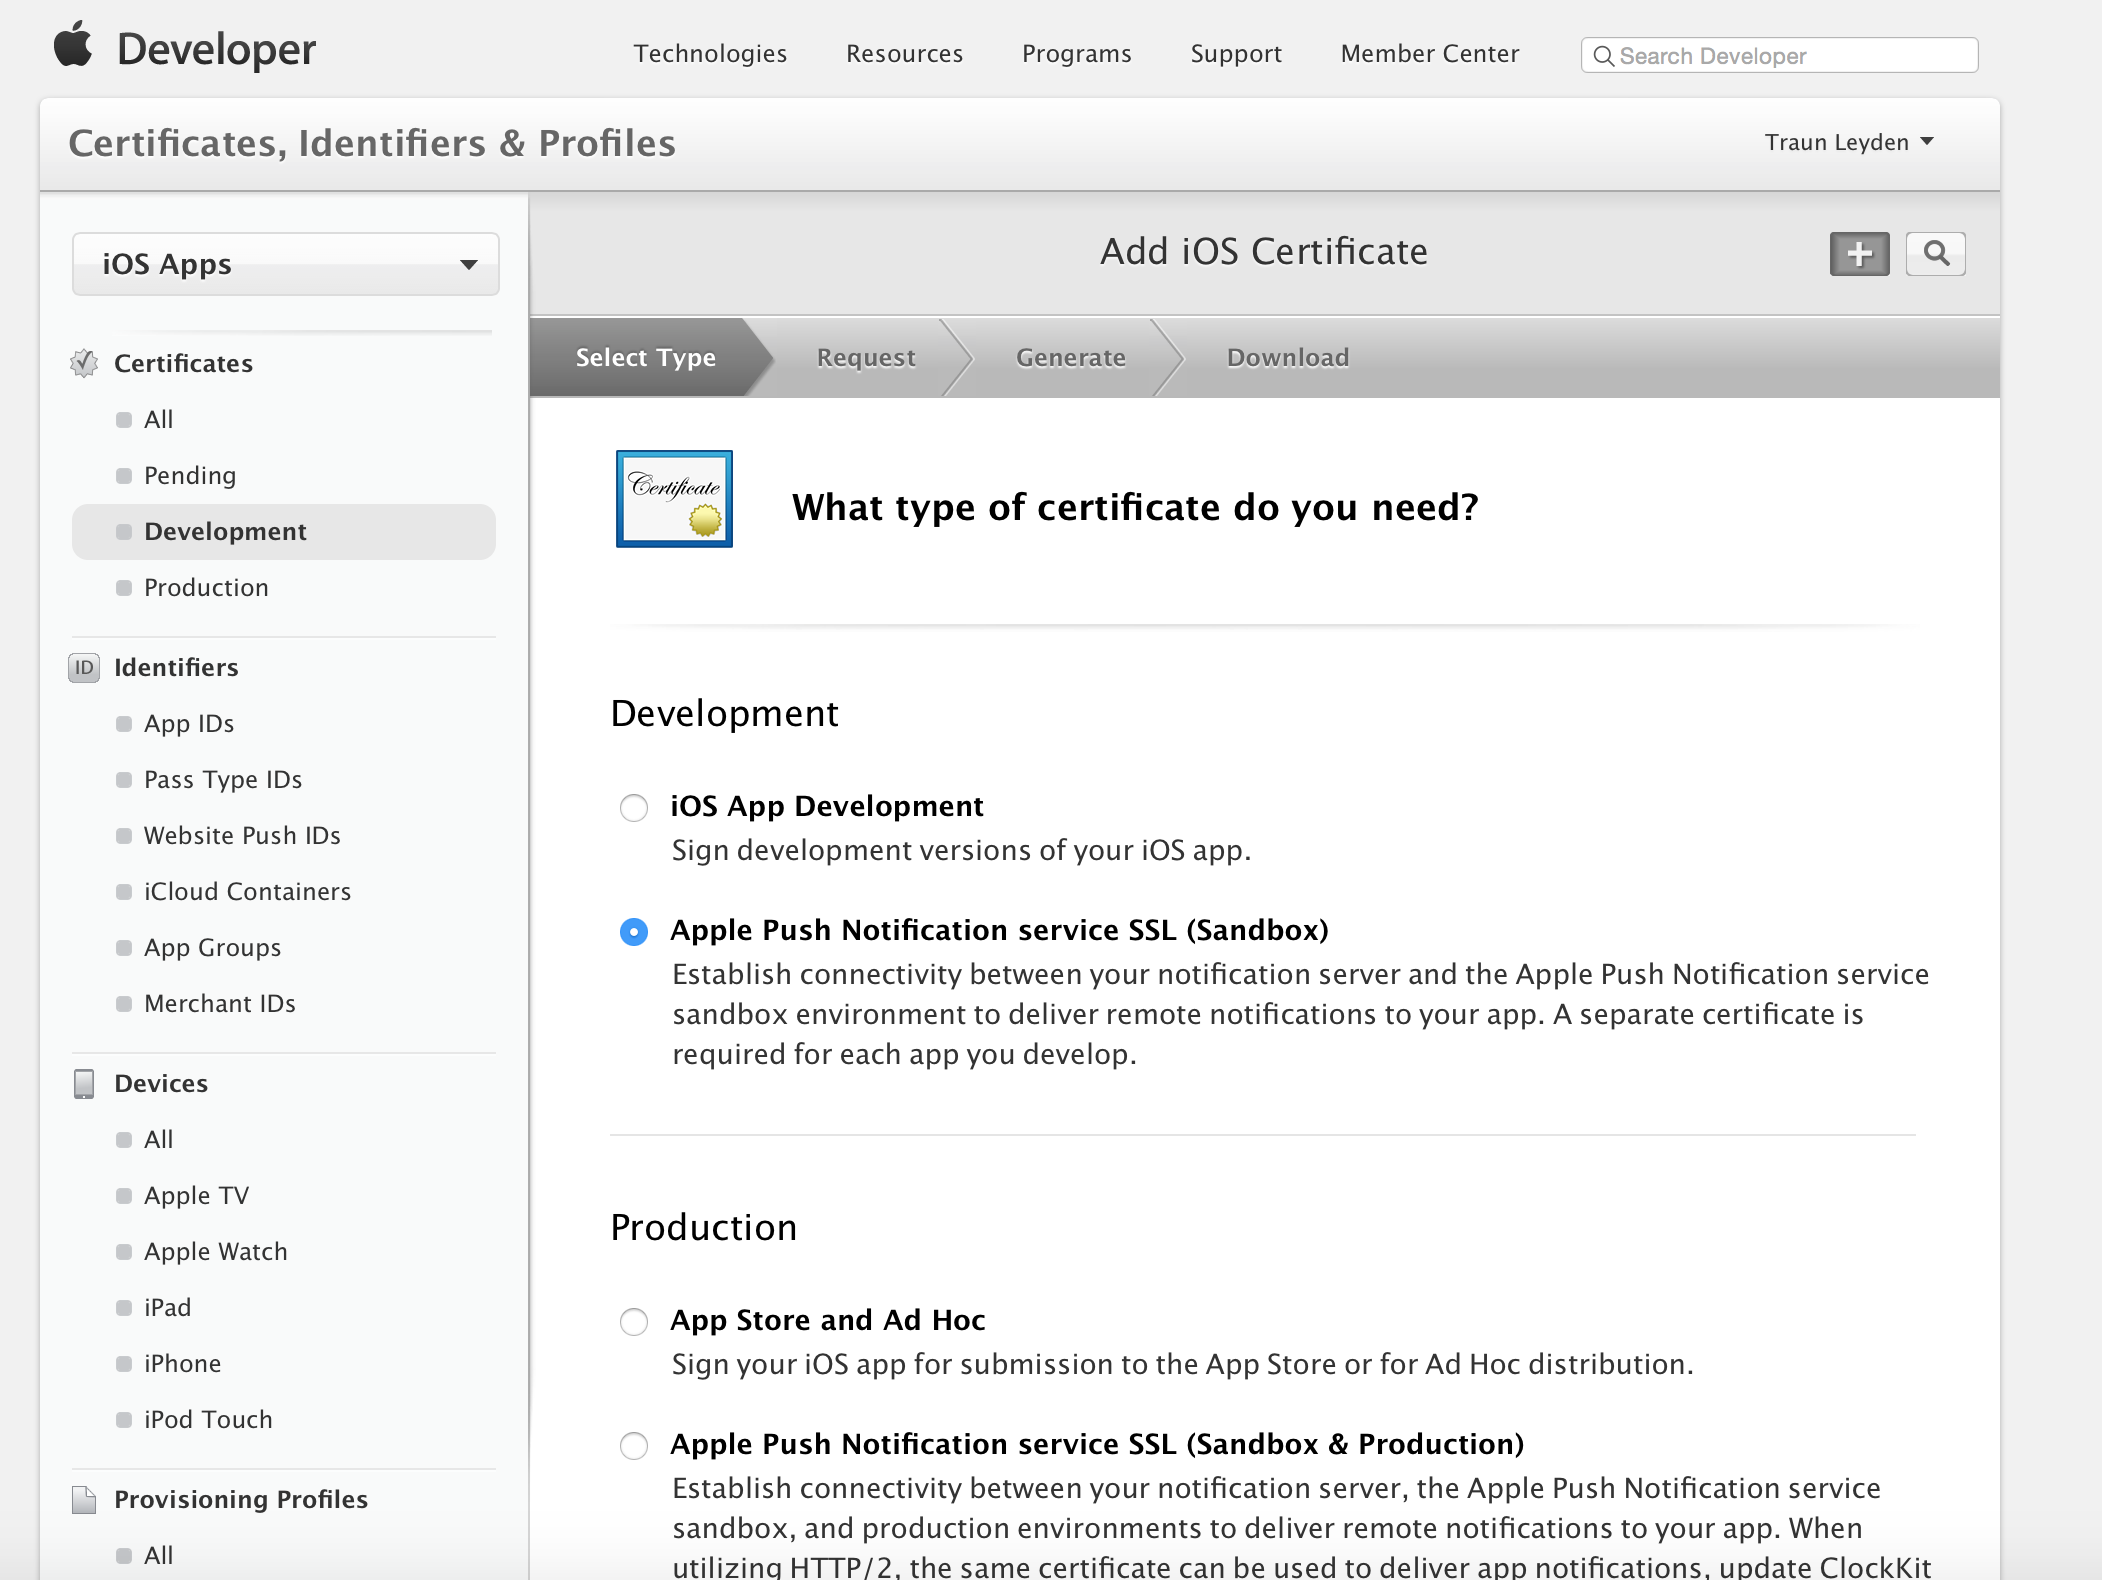
In my case, I already had an app id for my app (com.couchbase.todolite), but push notifications are not enabled, so I needed to enable them:
Create a new push cert:
Choose the correct app id:
Generate CSR according to instructions in keychain:
This will save a CSR on your file system, and the next wizard step will ask you to upload this CSSR and generate the certificate. Now you can download it:
Double click the downloaded cert and it will be added to your keychain.
This is where I got a bit confused, since I had to also download the cert from the app id section — go to the app id and hit “Edit”, then download the cert and double click it to add to your keychain. (I’m confused because I thought these were the same certs and this second step felt redundant)
Create and use provisioning profile
Go to the Provisioning Profiles / Development section and hit the “+” button:
Choose all certs and all devices, and then give your provisioning profile an easy to remember name.
Download this provisioning profile and double click it to install it.
In xcode under Build Settings, choose this provisioning profile:
Register for push notifications in your app
Add the following code to your didFinishLaunchingWithOptions::
If you now run this app on a simulator, you can expect an error like Error registering device token. Push notifications will not workError.
Run the app on a device you should see a popup dialog in the app asking if it’s OK to receive push notifications, and the following log messages in the xcode console:
Open keychain, select the login keychain and the My Certificates category:
Right click on the certificate (not the private key) “Apple Development Push Services: (your app id)”
Choose Export “Apple Development Push Services: (your app id)″.
Save this as apns-prod-cert.p12 file somewhere you can access it.
When it prompts you for a password, leave it blank (or add one if you want, but this tutorial will assume it was left blank)
Repeat with the private key (in this case, TodoLite Push Notification Cert) and save it as apns-prod-key.p12.
Now they need to be converted from .p12 to .pem format.
123
$ openssl pkcs12 -clcerts -nokeys -out apns-prod-cert.pem -in apns-prod-cert.p12
Enter Import Password: <return>
MAC verified OK
1234
$ openssl pkcs12 -nocerts -out apns-prod-key.pem -in apns-prod-key.p12
Enter Import Password:
MAC verified OK
Enter PEM pass phrase: hello <return>
Remove the PEM passphrase:
123
$ openssl rsa -in apns-prod-key.pem -out apns-prod-key-noenc.pem
Enter pass phrase for apns-prod-key.pem: hello
writing RSA key
Add PEM files to Uniqush docker container
When you call the Uniqush REST API to add a Push Service Provider, it expects to find the PEM files on it’s local file system. Use the following commands to get these files into the running container in the /tmp directory:
Using the cleaned up device token from the previous step 281c87101b029fdb16c8e13439436336116001cebf6519e68edefab523dab1e9, create a subscriber with the name mytestsubscriber via:
First, you need to either background your app by pressing the home button, or add some code like this so that an alert will be shown if the app is foregrounded.
]]><![CDATA[Running Neural Style on an AWS GPU instance]]>2015-11-22T11:02:00-08:00http://tleyden.github.io/blog/2015/11/22/running-neural-style-on-an-aws-gpu-instanceThese instructions will walk you through getting neural-style up and running on an AWS GPU instance.
./deviceQuery Starting...
CUDA Device Query (Runtime API) version (CUDART static linking)
Detected 1 CUDA Capable device(s)
Device 0: "GRID K520"
CUDA Driver Version / Runtime Version 6.5 / 6.5
... snip ...
deviceQuery, CUDA Driver = CUDART, CUDA Driver Version = 6.5, CUDA Runtime Version = 6.5, NumDevs = 1, Device0 = GRID K520
Result = PASS
Verify: Find all your nvidia devices
1
$ ls -la /dev | grep nvidia
You should see:
123
crw-rw-rw- 1 root root 195, 0 Oct 25 19:37 nvidia0
crw-rw-rw- 1 root root 195, 255 Oct 25 19:37 nvidiactl
crw-rw-rw- 1 root root 251, 0 Oct 25 19:37 nvidia-uvm
ami-84c787ee — this AMI has everything pre-installed, however it is installed on the host rather than under docker, which was due to time constraints.
]]><![CDATA[Running the Sync Gateway Amazon AMI]]>2015-11-03T11:11:00-08:00http://tleyden.github.io/blog/2015/11/03/running-the-sync-gateway-amazon-amiHow to run the Couchbase Sync Gateway AWS AMI
Go to the AWS console, find the EC2 instance, and find the instance public ip address. It should look like this: ec2-54-161-201-224.compute-1.amazonaws.com. The rest of the instructions will refer to this as
ssh ec2-user@<instance public ip> (this should let you in without prompting you for a password. if not, you chose a key when you launched that you don’t have locally)
2015-11-03T19:37:05.384Z ==== Couchbase Sync Gateway/1.1.0(28;86f028c) ====
2015-11-03T19:37:05.384Z Opening db /sync_gateway as bucket "sync_gateway", pool "default", server <http://localhost:8091>
2015-11-03T19:37:05.384Z Opening Couchbase database sync_gateway on <http://localhost:8091>
2015/11/03 19:37:05 Trying with selected node 0
2015/11/03 19:37:05 Trying with selected node 0
2015-11-03T19:37:05.536Z Using default sync function 'channel(doc.channels)' for database "sync_gateway"
2015-11-03T19:37:05.536Z Reset guest user to config
2015-11-03T19:37:05.536Z Starting profile server on
2015-11-03T19:37:05.536Z Starting admin server on 127.0.0.1:4985
2015-11-03T19:37:05.550Z Starting server on localhost:4984 ...
Verify via curl
From your workstation:
1
$ curl http://<instance public ip>:4984/sync_gateway/
For more advanced Sync Gateway configuration, you will want to create a JSON config file on the EC2 instance itself and pass that to Sync Gateway when you launch it, or host your config JSON on the internet somewhere and pass Sync Gateway the URL to the file.
View Couchbase Server UI
In order to login to the Couchbase Server UI, go to :8091 and use: